Ratio forecasting shows you how many children are expected to attend in the coming days, so you can plan staffing ahead of time. It uses enrollment numbers, planned absences, and historical patterns to predict attendance.Documentation Index
Fetch the complete documentation index at: https://readyrule.com/docs/llms.txt
Use this file to discover all available pages before exploring further.
Quick start
On the dashboard
Find the 7-Day Attendance Forecast widget
Look for the forecast widget on your dashboard. Each day shows the projected number of children, a color-coded status, and staff needs if additional help is required.
Check the colors
| Color | Status | What it means |
|---|---|---|
| Green | Compliant | Ratios look good |
| Yellow | Warning | Getting busy (80-90% of capacity) |
| Orange | Critical | Very busy (90-100% of capacity) |
| Red | Exceeded | Over capacity, need more staff |
On the forecast page
- In the sidebar navigation, click Ratio Forecast
- See detailed projections by age group
- Check which days need extra staff
- View forecast accuracy metrics
Reading the dashboard widget
The widget shows 7 small cards, one for each upcoming day. Each card shows the day name, projected children count, and a staff badge if additional staff is needed. Example: A green card with “18” means you are expecting 18 children and current staffing should handle it fine. A red card with “22” and “+2 staff” means you are expecting 22 children and need 2 additional staff members.Reading the full forecast page
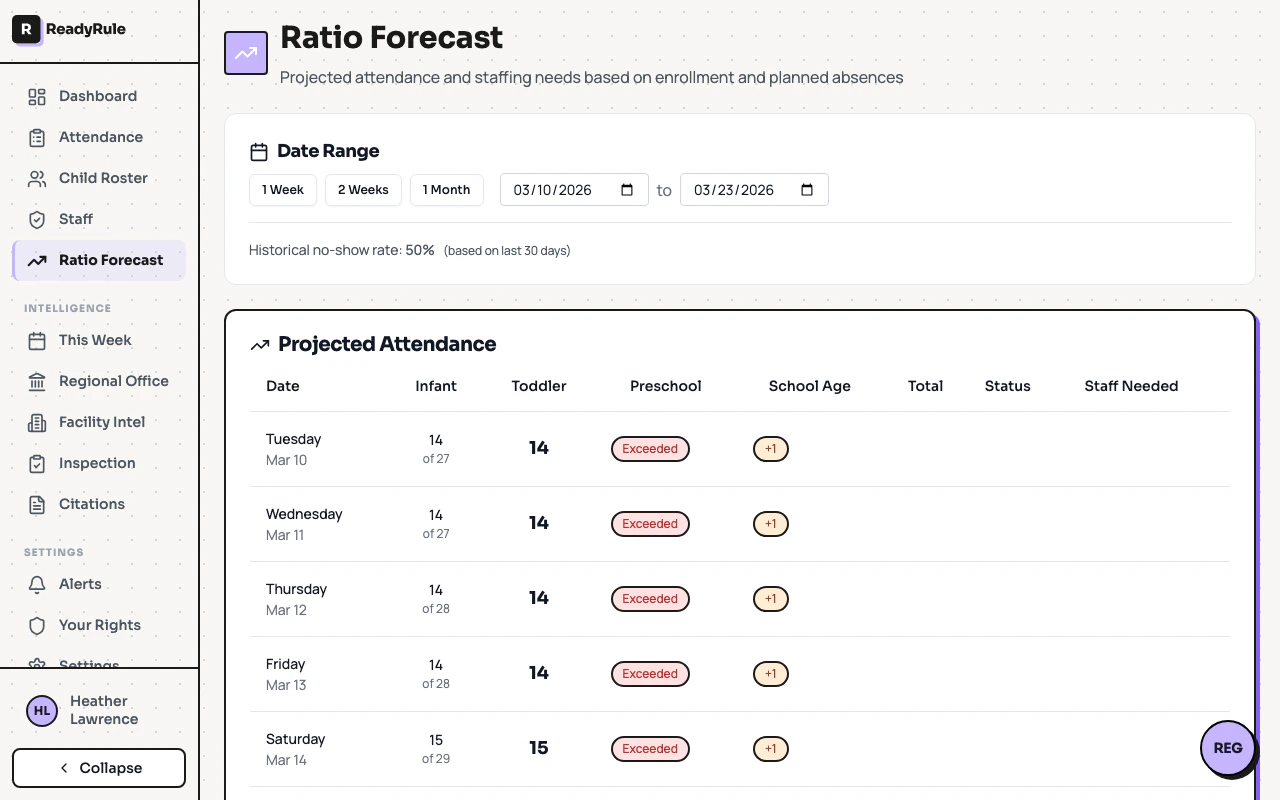
Date range selection
Choose how far ahead to look: 1 Week (quick check), 2 Weeks (recommended), 1 Month (long-term), or custom dates. The page also shows your historical no-show rate based on the last 30 days.Projected attendance table
| Column | What it means |
|---|---|
| Date | Day of week and calendar date |
| Age groups | Projected/enrolled for infants, toddlers, preschool, school age |
| Total | Total projected attendance |
| Status | Color-coded badge (Compliant, Warning, Critical, Exceeded) |
| Staff Needed | ”OK” or “+1”, “+2” (additional staff needed) |
When additional staff is needed
Below the table, you will see a Staffing Recommendations card:- Green card: “Staffing looks adequate for the forecast period”
- Yellow card: Lists specific days that need extra staff
- Infants (0-18 months): 1 staff per 4 children
- Toddlers (18-36 months): 1 staff per 12 children
- Preschool (3-5 years): 1 staff per 24 children
- School Age (5+ years): 1 staff per 14 children
Understanding forecast accuracy
At the bottom of the page, the Forecast Accuracy section shows how well predictions matched reality.| Rating | Accuracy range | What it means |
|---|---|---|
| Excellent | 85% or higher | Very reliable predictions |
| Good | 70-84% | Generally reliable |
| Needs Improvement | Below 70% | Consider marking more absences |
Day-to-day usage
Monday morning routine
- Check the 7-Day Forecast widget on your dashboard
- Note which days show staff warnings (yellow/orange/red)
- Alert your director about upcoming staffing needs
Before you leave for the day
Quick glance at tomorrow’s forecast. Green means good to go. Yellow, orange, or red means confirm staffing with your director.Weekly planning
Once a week (e.g., Friday afternoon): open Ratio Forecast from the sidebar, select the 2 Weeks range, review staffing recommendations, and share with your director.Tips for better forecasts
- Mark absences immediately: When a parent calls about an absence, mark it in the system right away. The forecast updates instantly.
- Cancel absences when plans change: If a child is coming back early, cancel the remaining absence days.
- Share concerns with your director: If you notice staffing warnings for multiple days, let your director know today so they have time to adjust schedules.
Troubleshooting
The forecast shows 'Failed to load forecast'
The forecast shows 'Failed to load forecast'
Refresh the page. If it persists, contact support.
The forecast shows very low numbers
The forecast shows very low numbers
Check if the no-show rate is unusually high or if many children have planned absences. Weekends and holidays will naturally show lower numbers.
Does this replace head counts?
Does this replace head counts?
No. You still need to do physical head counts for safety and compliance. This tool helps with advance planning, not day-of-attendance tracking.
Can parents see this?
Can parents see this?
No. Forecasting is staff-only. It is a planning tool for internal use.
How far ahead can I see?
How far ahead can I see?
Up to 1 month. Beyond that, predictions become less reliable due to changing enrollment and patterns.
Quick reference
| Action | Where |
|---|---|
| Quick 7-day glance | Dashboard widget |
| Detailed breakdown | Sidebar > Ratio Forecast |
| Update projections | Mark a child absent in Child Roster |
| Check prediction quality | Forecast page > Forecast Accuracy section |