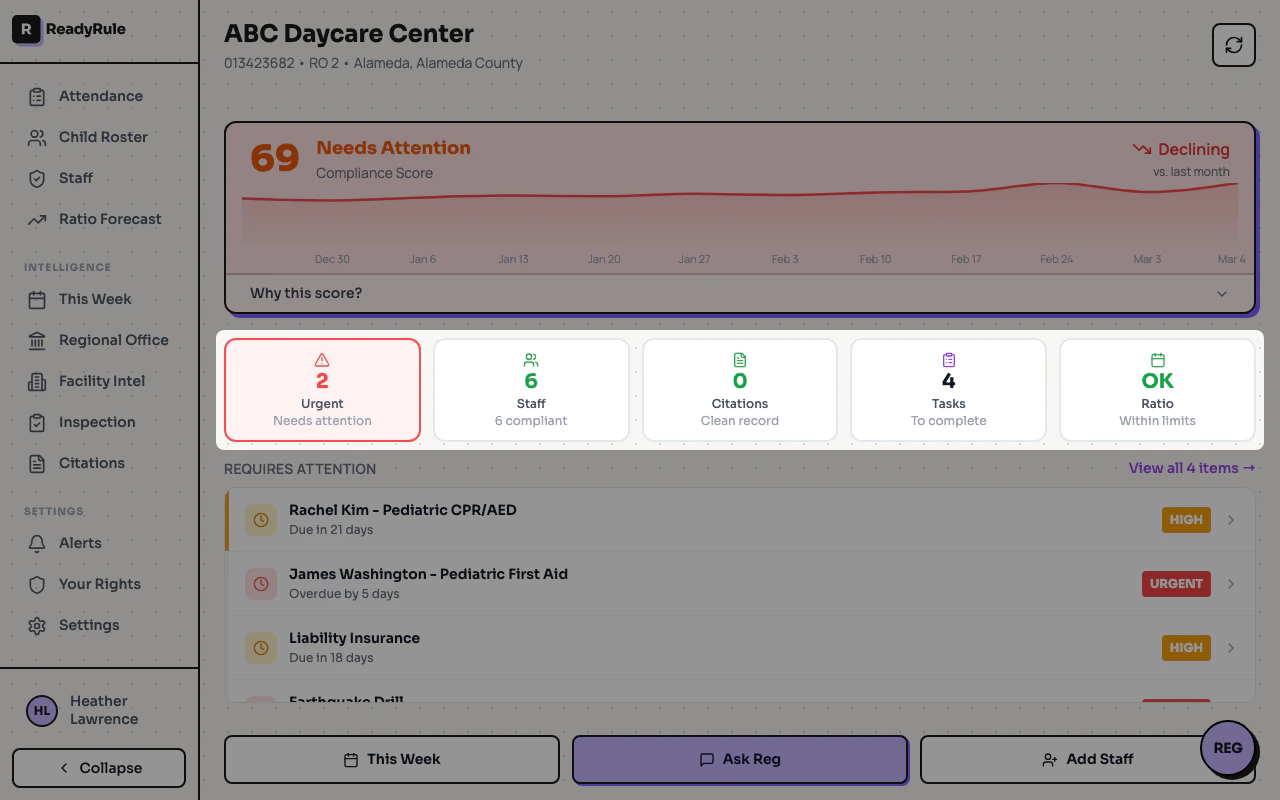
The dashboard is your compliance command center. It shows your facility’s live compliance score, active alerts, staff status, and quick actions — all on one screen.Documentation Index
Fetch the complete documentation index at: https://readyrule.com/docs/llms.txt
Use this file to discover all available pages before exploring further.
What you see
The dashboard adapts to your screen size. On desktop, it displays a fixed-viewport command center. On mobile, it shows a launcher with stat chips and modals.Compliance score
The hero section displays your live compliance score with a trend indicator. Click it to view the score breakdown by category and a historical trend chart.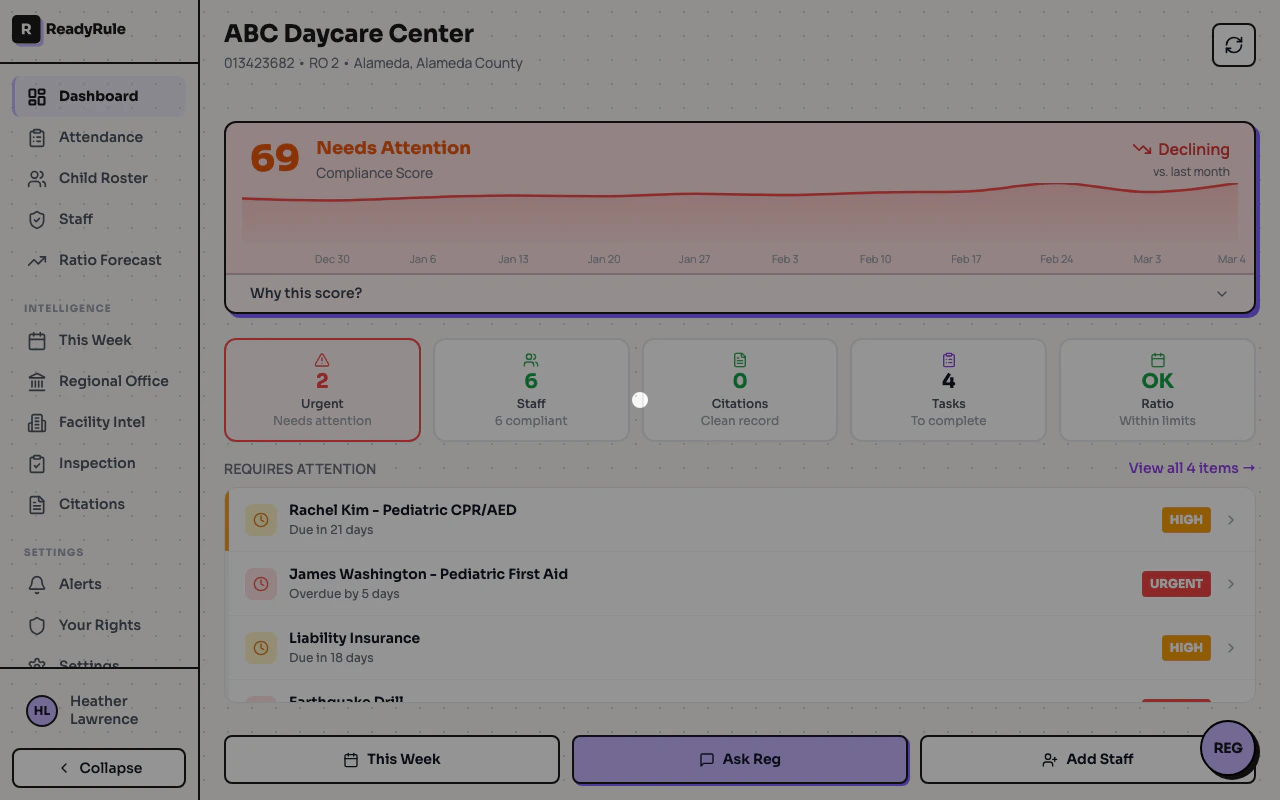
Stat chips
Below the score, a row of stat chips gives you a quick read on:- Urgent alerts — action items that need immediate attention
- Staff — total staff count and expiring certifications
- Citations — total citations and Type A count
- Risk level — facility intel urgency assessment
Alerts list
The alerts section shows your active action items sorted by priority. Each alert links to the relevant page for resolution. This section expands to fill available space so you always see as many alerts as possible.Quick actions
A bottom action bar provides one-tap access to common tasks like viewing the checklist, opening attendance, or starting an inspection walkthrough.Refresh data
Click the refresh button in the top-right corner to pull the latest compliance data. The dashboard also auto-refreshes attendance data every 60 seconds when viewing today’s date.Troubleshooting
Dashboard shows 'Failed to load'
Dashboard shows 'Failed to load'
Check your internet connection and click Try Again. If the issue persists, log out and log back in.
Compliance score seems wrong
Compliance score seems wrong
The score is calculated from your citation history and current compliance status. Review your citations page to verify all records are accurate.