The Inspection Readiness dashboard analyzes your facility’s complete inspection history and gives you actionable intelligence about what to expect during your next LPA visit. Navigate to Inspection > Readiness from the main menu.Documentation Index
Fetch the complete documentation index at: https://readyrule.com/docs/llms.txt
Use this file to discover all available pages before exploring further.
Quick start: getting oriented
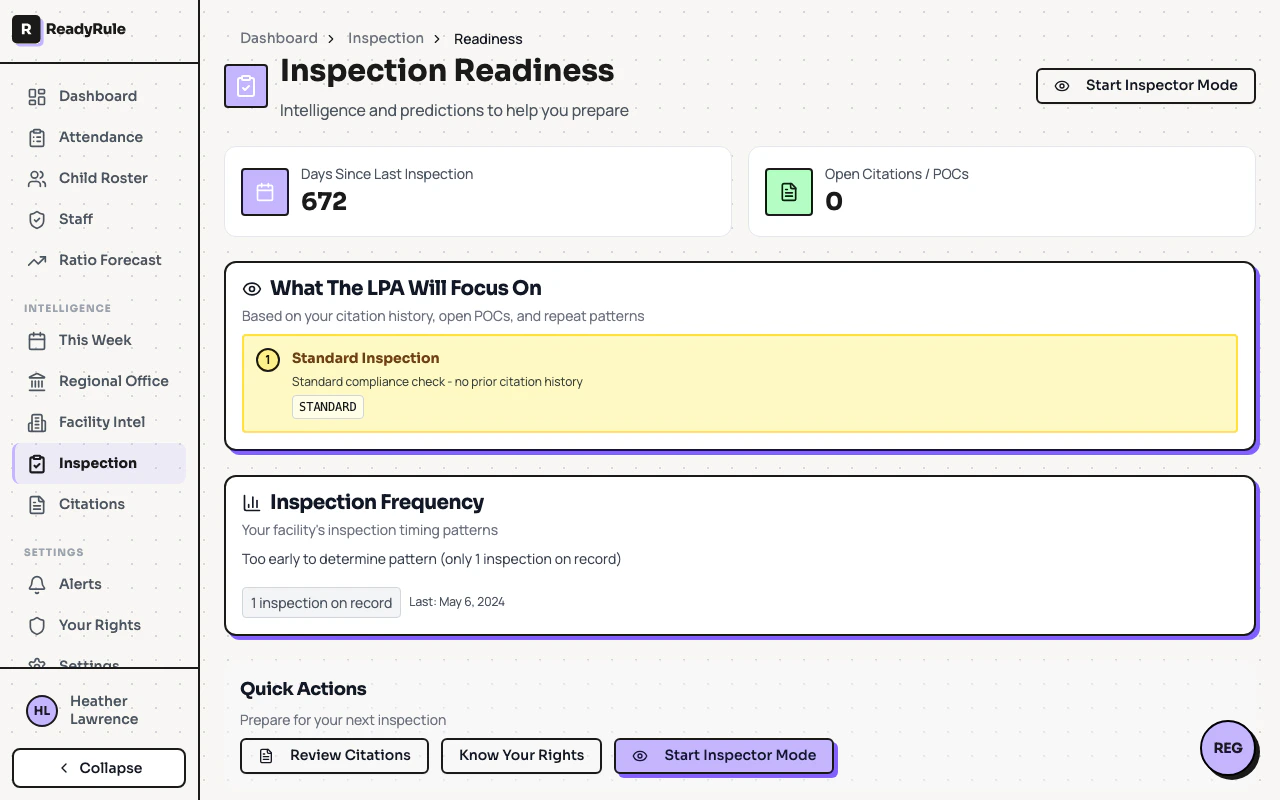
When you open the dashboard, you will see four main sections: summary metrics at the top, focus predictions for what the LPA will check, repeat violation risk windows with countdown timers, and inspection frequency analysis.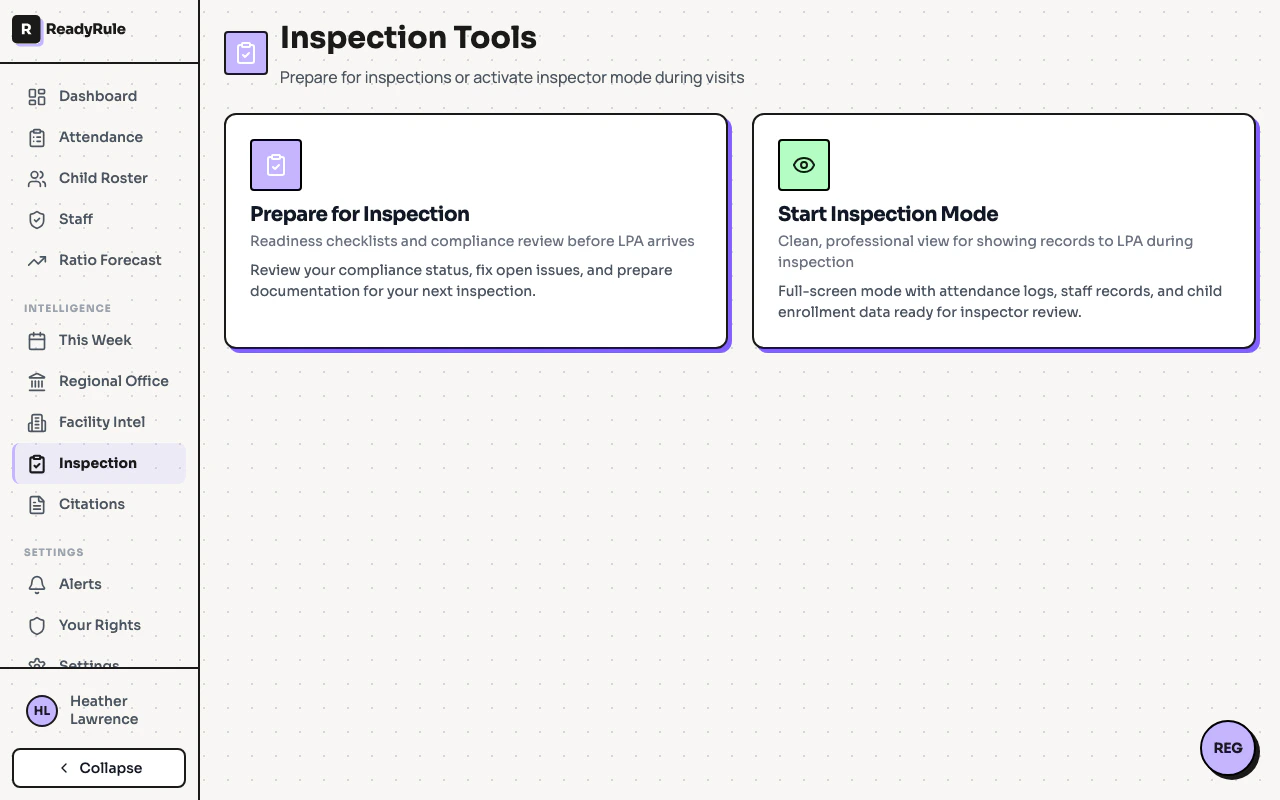
Understanding each section
Summary metrics (top cards)
| Card | What it shows | Why it matters |
|---|---|---|
| Days Since Last Inspection | Number of days since the LPA last visited | Helps predict when the next visit is likely |
| Open Citations / POCs | Count of unresolved Plans of Correction | These are your top priority items |
What the LPA will focus on
This is the most important section. It lists, in priority order, the specific areas inspectors are most likely to check during your next visit. Each prediction shows a priority number, category name, reason for flagging, regulation code, citation severity (Type A or Type B), and POC due date if applicable.Priority levels
| Color | Priority | What it means |
|---|---|---|
| Red background | Critical | Open Plan of Correction — inspectors will verify this |
| Orange background | High | Cited during last visit — likely to be rechecked |
| Yellow background | Moderate | Part of citation history pattern |
Citation severity badges
| Badge | Meaning |
|---|---|
| Type A (red) | Serious violation posing immediate risk to children’s health or safety |
| Type B (orange) | Minor violation that does not pose immediate risk but still requires correction |
Repeat violation risk windows
When your facility receives a citation, that citation stays in a 12-month “repeat violation window.” If you are cited for the same regulation again within those 12 months, it becomes a repeat violation with significantly higher penalties. Each countdown displays the citation number, days remaining, a progress bar, last cited date, and whether it is already a repeat.| Color | Urgency | Days remaining | What to do |
|---|---|---|---|
| Red | Critical | Less than 30 | Stay vigilant — you are almost clear |
| Orange | High | Less than 60 | Continue documenting compliance efforts |
| Yellow | Moderate | Less than 90 | Review your corrective actions are still in place |
| Green | Low | More than 90 | Monitor periodically |
Inspection frequency
This section analyzes your historical inspection patterns, showing average frequency between inspections, days since last visit, total inspections on record, inspector name, and whether the last visit was triggered by a complaint.Preparing for your next inspection
Review open Plans of Correction
Check the “Open Citations / POCs” count. For each open POC, confirm the corrective action is fully implemented. Gather documentation proving the correction (photos, policy updates, training records). Note the POC due dates shown in the Focus Predictions section.
Study the focus predictions
Read each prediction from top to bottom (they are ranked by priority). For critical items, have documentation ready at hand. For high items, walk through the relevant area of your facility. For Type A violations, prepare extra thorough documentation.
Check repeat violation windows
Look at any countdown with less than 90 days remaining. Ensure you are in full compliance with those specific regulations.
Quick actions
The bottom of the dashboard provides shortcut buttons:| Button | What it does |
|---|---|
| Review Citations | Opens your full citation history for detailed review |
| Know Your Rights | Shows your rights during an inspection |
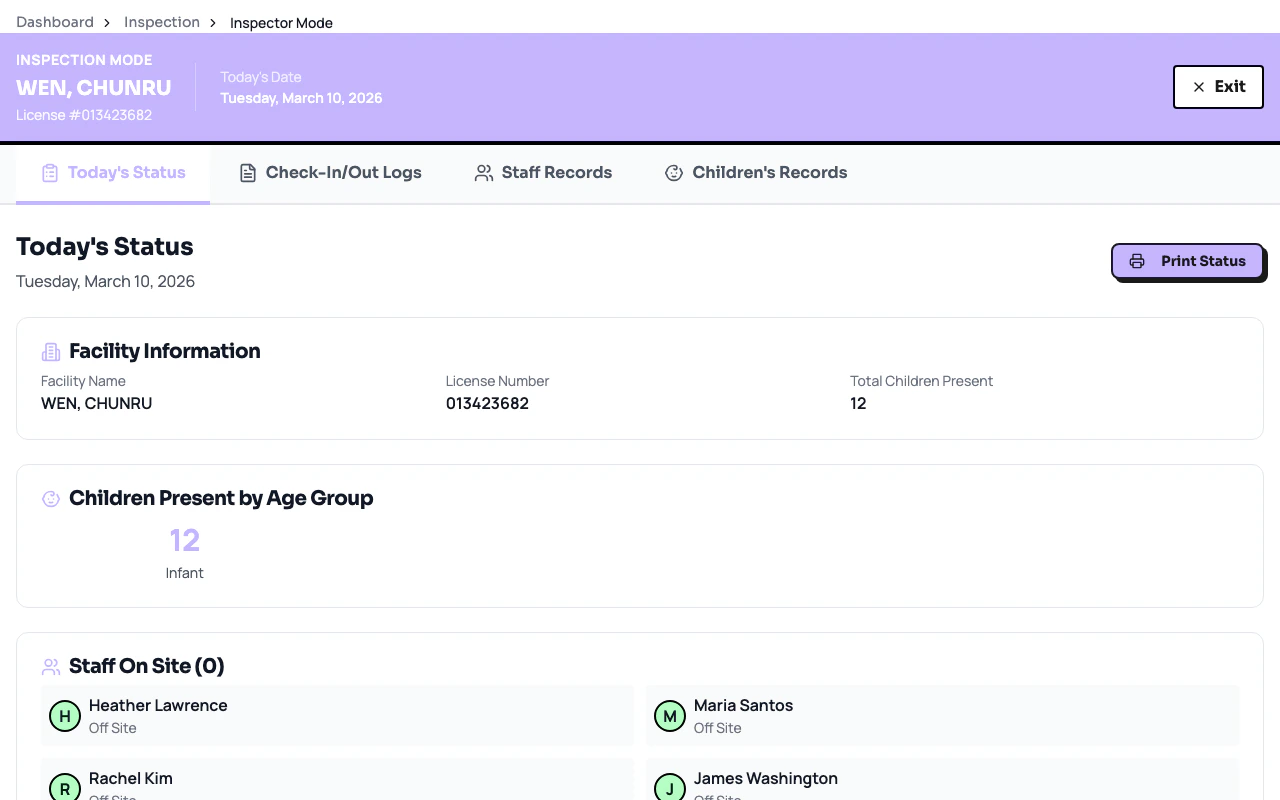
| Start Inspector Mode | Launches a guided walkthrough of what inspectors check |
Troubleshooting
How often should I check this dashboard?
How often should I check this dashboard?
Check at least once per week. If your “Days Since Last Inspection” is approaching or exceeding your average frequency, check more often and ensure your facility is inspection-ready at all times.
The data seems outdated
The data seems outdated
The dashboard pulls from public licensing records, which can take 1-2 weeks to reflect recent inspections. This is normal processing delay.
I see a warning that some data may be incomplete
I see a warning that some data may be incomplete
A yellow banner at the top indicates partial data. This can happen when your facility is newly claimed, records are still being processed, or some historical data is not available electronically.
What if I have zero inspections on record?
What if I have zero inspections on record?
New facilities will show “N/A” for days since last inspection and no focus predictions. The dashboard becomes more useful after your first recorded inspection.
Can inspectors see this dashboard?
Can inspectors see this dashboard?
No. This dashboard is private to your facility account. Inspectors use their own systems and checklists.
What is the difference between this and the Facility Intel report?
What is the difference between this and the Facility Intel report?
The Facility Intel report predicts when an inspection might happen based on regional patterns. The Inspection Readiness dashboard tells you what to prepare for based on your citation history. Use both together for complete preparation.
Key takeaways
- Focus on red items first — Open POCs and Type A citations are your highest priority.
- Know your repeat windows — A repeat violation carries escalated consequences.
- Use Focus Predictions as your checklist — They show exactly what the LPA will look at.
- Track inspector patterns — Note who inspects your facility and what they emphasize.
- Complaint visits are signals — Treat them seriously even if no citations result.
- Prepare documentation — Having proof of corrections ready is your best defense.
- Run Inspector Mode regularly — Walk your facility the way an inspector would.