Ratio forecasting predicts future attendance and staffing needs based on current enrollment, planned absences, and historical attendance patterns. This helps you plan staff schedules weeks in advance with confidence.Documentation Index
Fetch the complete documentation index at: https://readyrule.com/docs/llms.txt
Use this file to discover all available pages before exploring further.
Quick start: check weekly forecast
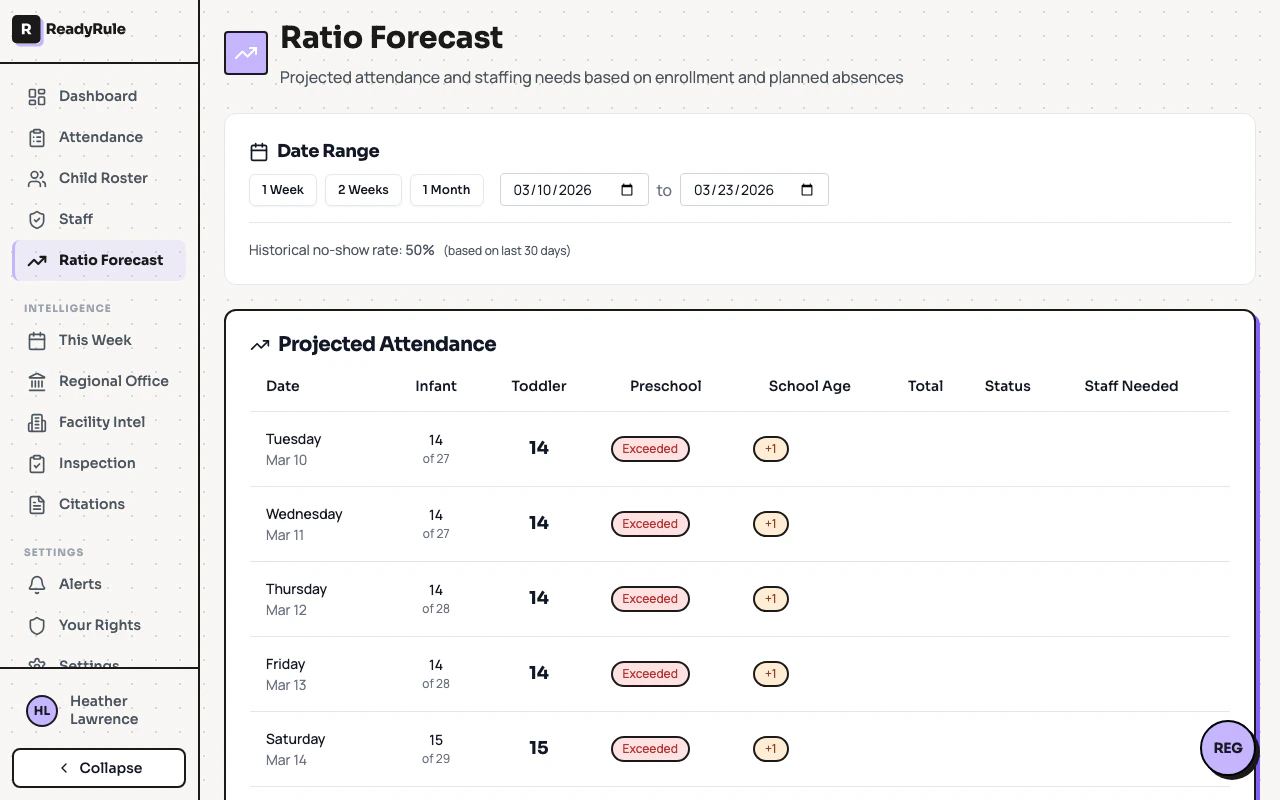
Select your date range
At the top of the page, choose a range:
- 1 Week: Next 7 days (immediate planning)
- 2 Weeks: Next 14 days (recommended for standard scheduling)
- 1 Month: Next 30 days (long-term planning)
Read the projected attendance table
The main table shows daily projections broken down by age group. Each row shows the date, projected attendance per age group (e.g., “4 of 5” means 5 enrolled, projecting 4 will attend), total projected attendance, compliance status, and staff needed.
Check the staffing recommendations
Below the table, a recommendations card shows which days need extra staff:
- OK (green): Current staffing is adequate
- +1, +2 (yellow): Number of additional staff members needed
Understanding the status columns
Status indicators
| Status | Color | What it means |
|---|---|---|
| Compliant | Green | Ratios will be met with current staffing |
| Warning | Yellow | Approaching ratio limits (80-90% capacity) |
| Critical | Orange | At ratio limits (90-100% capacity) |
| Exceeded | Red | Ratios will be exceeded without additional staff |
Forecast accuracy ratings
| Rating | Accuracy range | What it means |
|---|---|---|
| Excellent | 85% or higher | Trust these predictions |
| Good | 70-84% | Generally reliable, minor adjustments may be needed |
| Needs Improvement | Below 70% | Use caution, validate with other data |
Understanding no-show rate
The no-show rate is the percentage of enrolled children who don’t attend on a typical day, calculated from the last 30 days of actual attendance. Example calculation:- 28 children enrolled
- Historical no-show rate: 12%
- 2 children have planned absences today
- Eligible to attend: 28 - 2 = 26 children
- Projected attendance: 26 x (1 - 0.12) = 23 children
Staffing decision framework
| Status | Decision | Action |
|---|---|---|
| Green (Compliant, OK) | Maintain current staffing | None needed |
| Yellow (Warning, OK or +1) | Monitor closely | Have backup staff available |
| Orange (Critical, +1 or +2) | Schedule additional staff immediately | Confirm coverage before the day |
| Red (Exceeded, +2 or more) | Schedule additional staff and review enrollment | Multiple staff members needed |
Weekly planning workflow
Review the 2-week forecast every Monday morning
Look for days with additional staff needs and note any warning or critical status days.
Identify high-attendance days
Tuesday through Thursday are typically busiest. Plan extra staff for these days.
Check planned absences
The forecast automatically accounts for absences you have marked. If you mark more absences later, the forecast adjusts.
Schedule additional staff early
Call floaters or part-timers for days showing +1 or +2. Schedule early to ensure availability.
Forecast vs. dashboard
| Feature | Ratio Forecast page | Attendance Dashboard |
|---|---|---|
| Purpose | Plan future staffing | Track today’s attendance |
| Time range | 1 week to 1 month ahead | Today only |
| Audience | Directors, administrators | All staff |
| Update frequency | Changes with absences/enrollment | Real-time (every 60 seconds) |
Troubleshooting
Forecast shows 'Failed to load forecast'
Forecast shows 'Failed to load forecast'
Refresh the page and check your internet connection. If the problem persists, contact support.
Forecast accuracy shows 0%
Forecast accuracy shows 0%
Not enough historical data yet. Wait 7-14 days for the system to collect attendance data. Use enrollment numbers as a guide until accuracy improves.
Projected attendance seems too low
Projected attendance seems too low
Check the no-show rate at the top of the page. Review planned absences in the Child Roster and cancel any incorrect absences. If the no-show rate is unusually high, consider seasonal factors.
Projected attendance seems too high
Projected attendance seems too high
Verify all known absences are marked in the system. The forecast will adjust over 30 days as patterns stabilize.
Why does the forecast change from day to day?
Why does the forecast change from day to day?
Forecasts update based on new planned absences, changes in enrollment, and updates to the historical no-show rate. This is normal and ensures your forecast stays current.
Can I export or print the forecast?
Can I export or print the forecast?
Currently, forecasts are view-only. Take a screenshot or manually note days needing additional staff in your scheduling system.
Tips for directors
- Plan Monday morning meetings around forecasts: Review the 2-week forecast, assign staffing, discuss concerns.
- Share forecasts with your team: Let teachers know when high-attendance days are coming.
- Use forecasts for enrollment decisions: If you are consistently at “critical” or “exceeded” status, you may need to cap enrollment or hire more staff.
- Budget for forecast-driven staffing: Forecasts help you schedule part-time and floater staff more efficiently.
- Mark absences as soon as you know: The more accurate your absence data, the more accurate the forecast.